 OK
Good packs in the bin
More than 0.1% of production was rejected for no reason. On lines of this volume, it is the waste that costs the most money and the one that is least visible.
Home / Projects / Waste from false rejects
Case study · Dairy · Carton
A dairy plant was losing more than 0.1% of its production to false rejects: its inspection only checked whether the code was there or not, and it was throwing away good packs. On lines that some days exceed 250,000 packs, that means hundreds of good packs in the bin every day. On top of that, seal defects were ending up as wet pallets in the warehouse.
The starting point
The previous system only checked for the presence or absence of the code. Any variation in the print or in the position of the pack ended in a reject, and good packs were thrown away.
More than 0.1% of production was rejected for no reason. On lines of this volume, it is the waste that costs the most money and the one that is least visible.
A badly sealed pack leaks product on the pallet: wet pallets, lost packs and the risk of the customer returning the entire pallet.
The solution
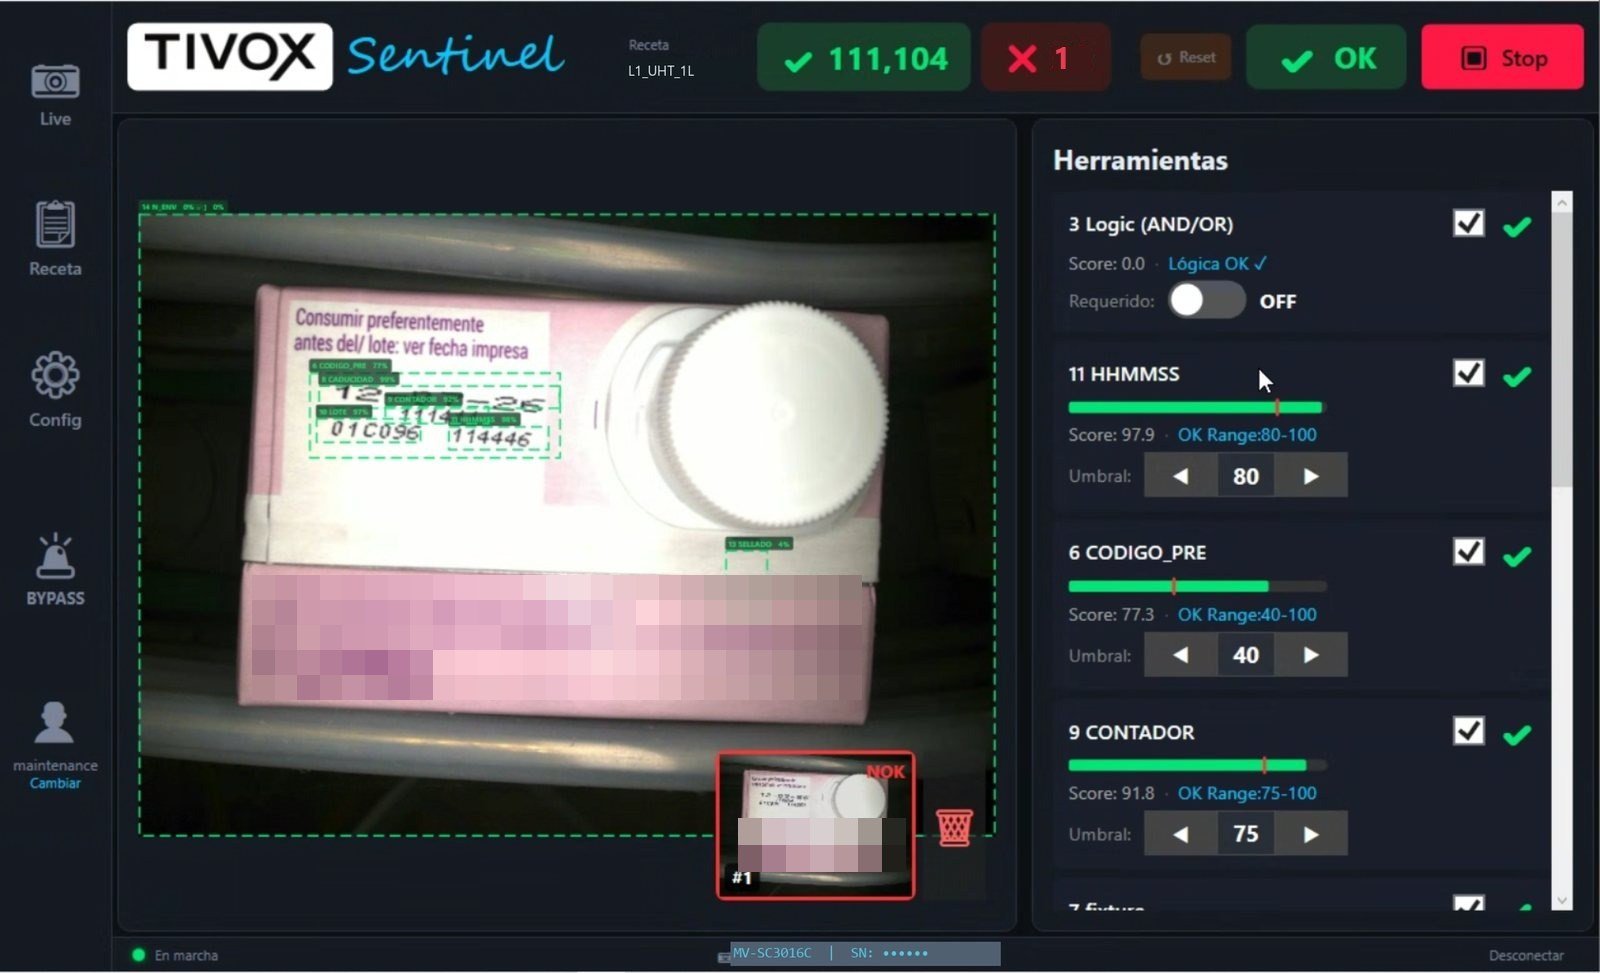
We replaced the presence check with OCR reading of the code, logging every pack, and added top and bottom seal measurement on both production lines.
The result
Between May and October 2026, 26,031,303 packs were inspected one by one, and total waste was 0.018% of production. Half of that figure is a cap test the plant carries out on purpose: it rejects 15 packs once or twice a day to check the capping. Without that test, waste is 0.009%, and that already includes the packs that were genuinely faulty, not just false rejects.
The inspection rejects what is genuinely wrong, and every decision is logged with its image. Producing more does not drive it up: on the 16 days of 250,000 packs or more, total waste was 0.014%.
Out-of-spec seals are rejected on the line, before palletising, avoiding the risk of returned pallets.
The rejected packs and the seal trends make it possible to study the fault and correct it on the filling machine.
Download the waste report (PDF)
The report sets out the line’s real data, without the customer’s name: waste by month, by production volume, by reject reason and by hour, and photos of the packs the camera sets aside.
More on each check: date and batch and seal inspection. If your current system also throws away good packs, the guide to false rejects explains where they come from.
Free remote review
Send us photos of your rejects and of good packs. We will tell you where the false rejects come from and what can be corrected.