 OK
OKPer shift, per day or per week
Production, rejects, stoppages and OEE by email, to whoever needs them and at the frequency you choose.
SHIFTDAYWEEKON DEMAND
Home / Software
Our own software · Sentinel PLUS
A single system, written by us, covers the whole chain: the camera that inspects, the operator's screen, the plant control centre, the view across all plants and the report with OEE and AI analysis. Everything is configurable and adapts to the way your plant works.
The system, screen by screen
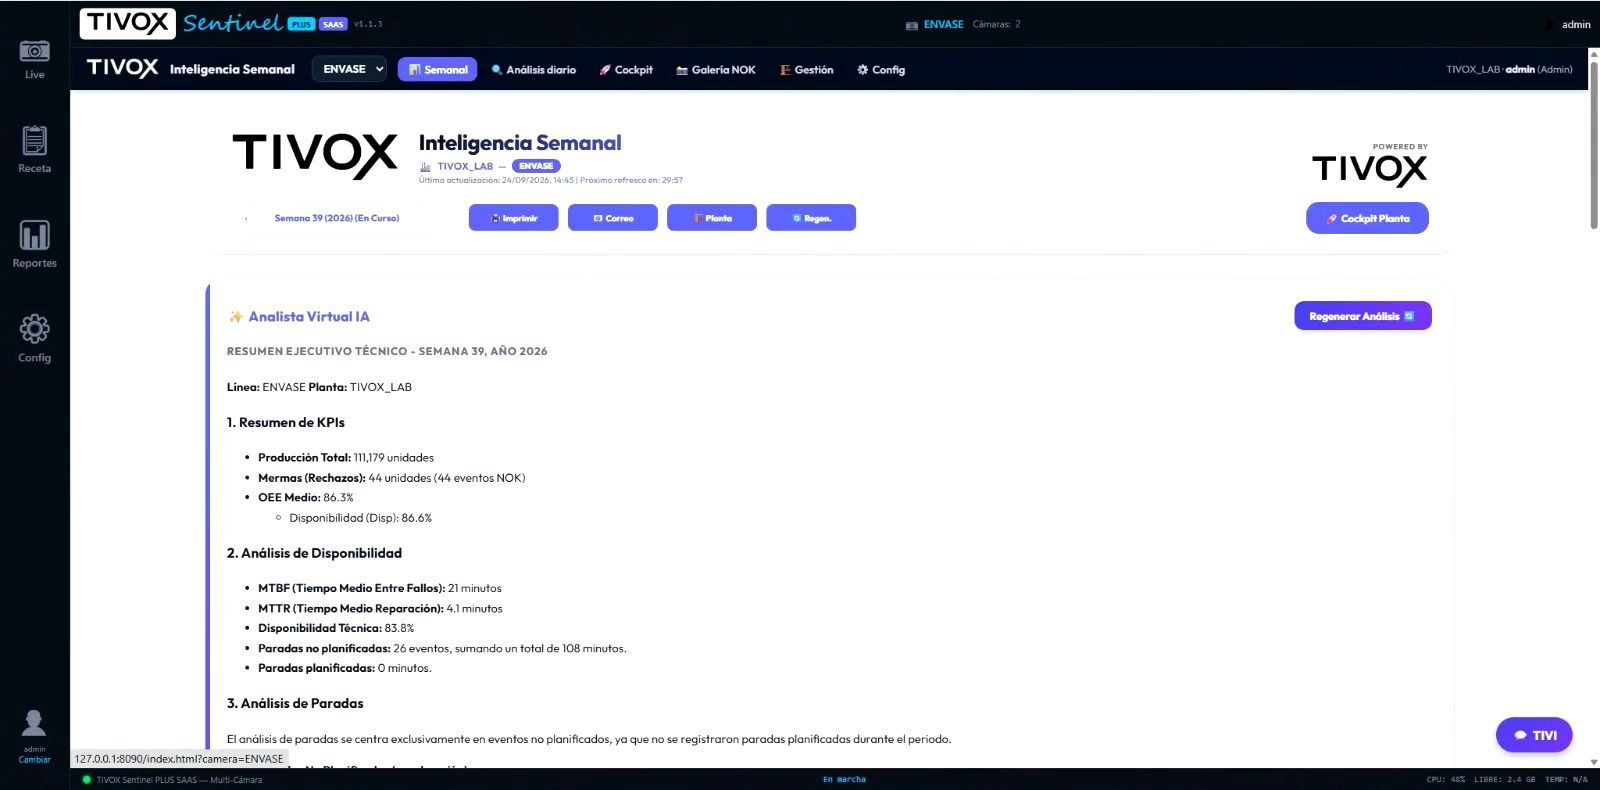
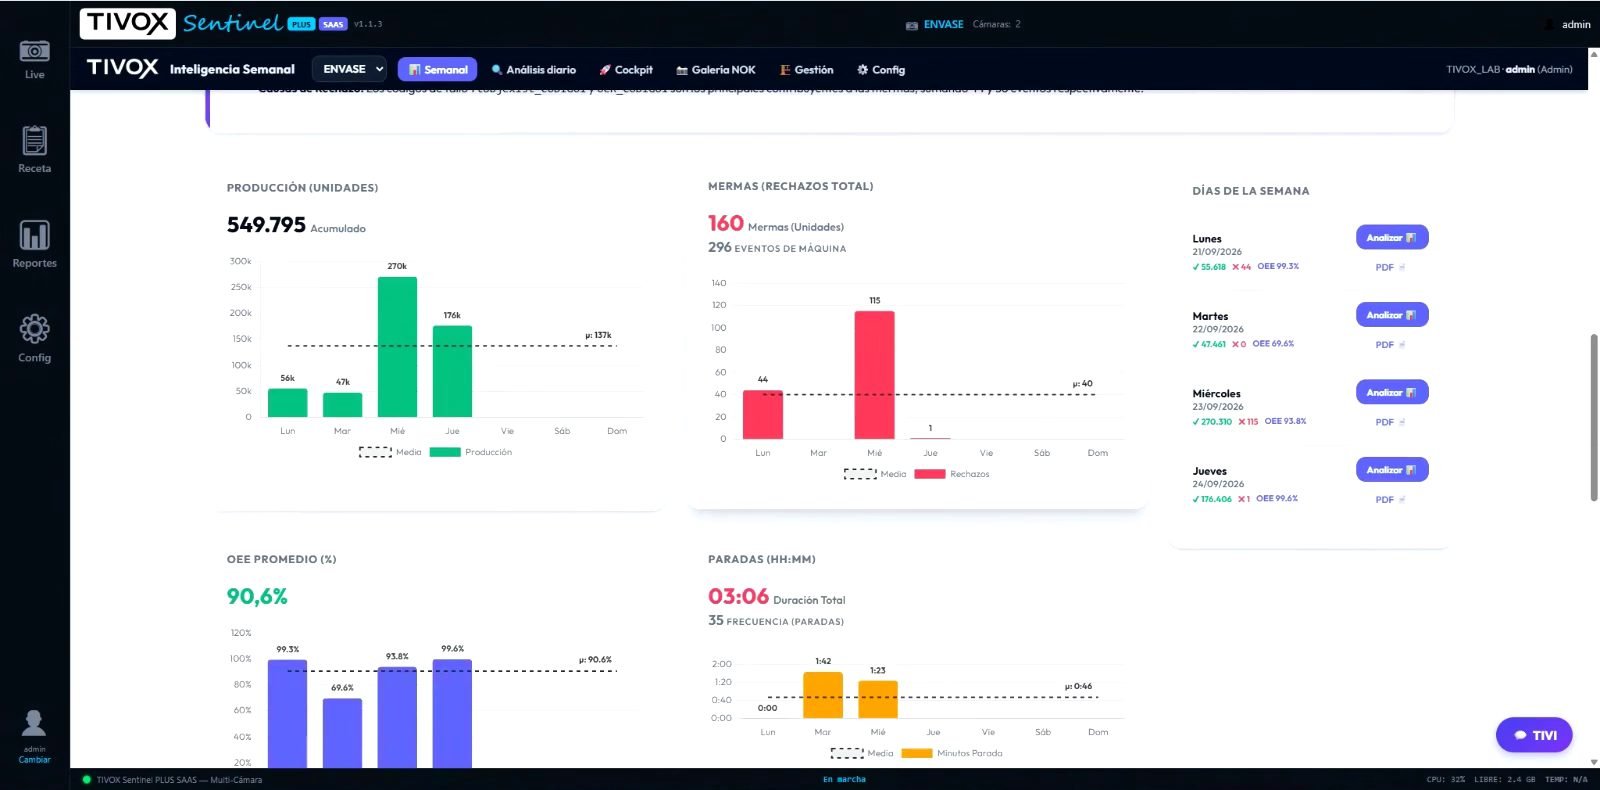
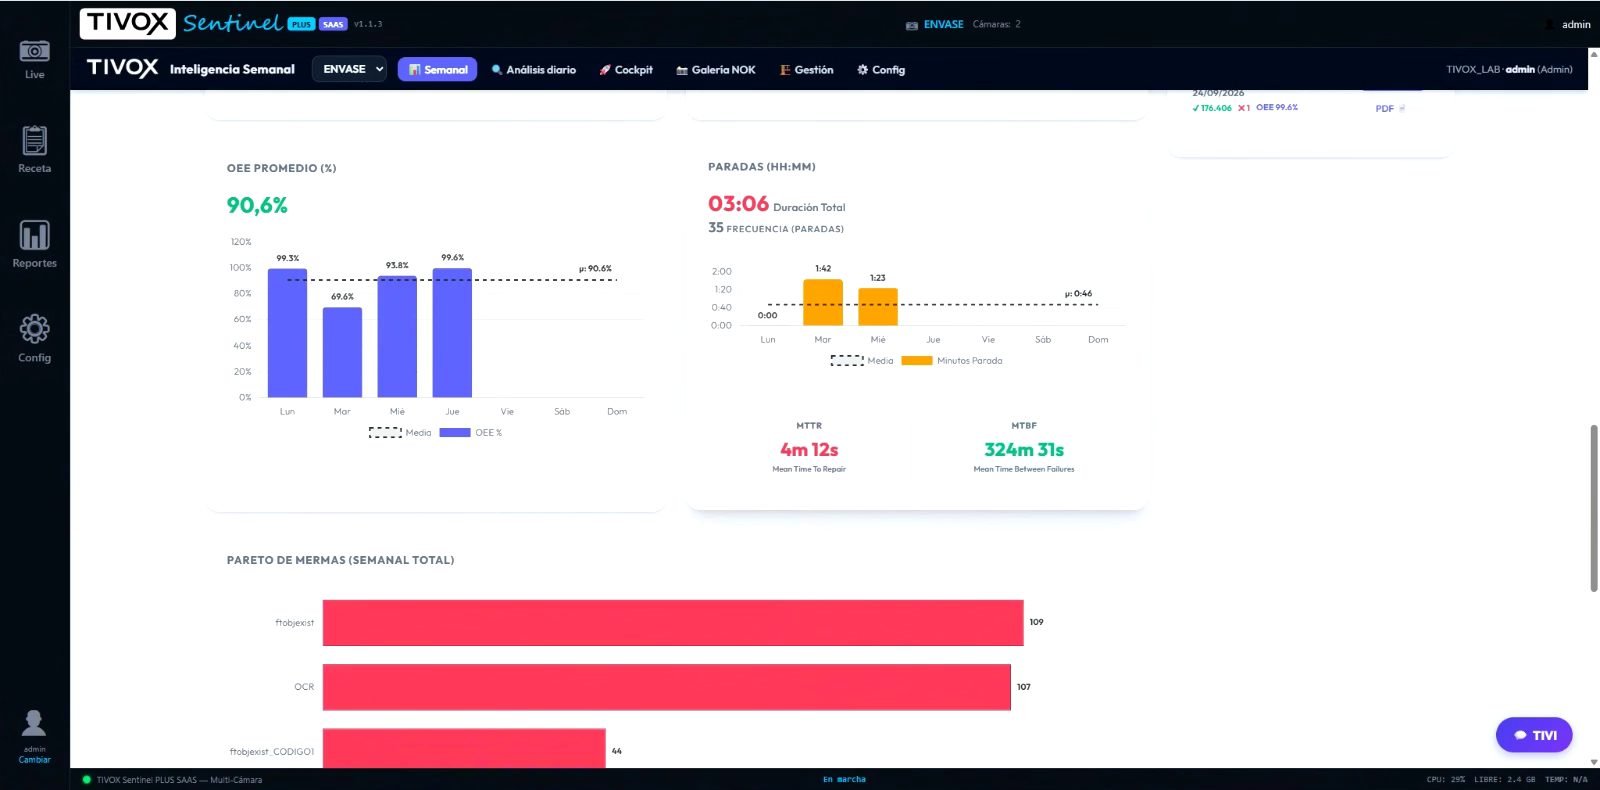
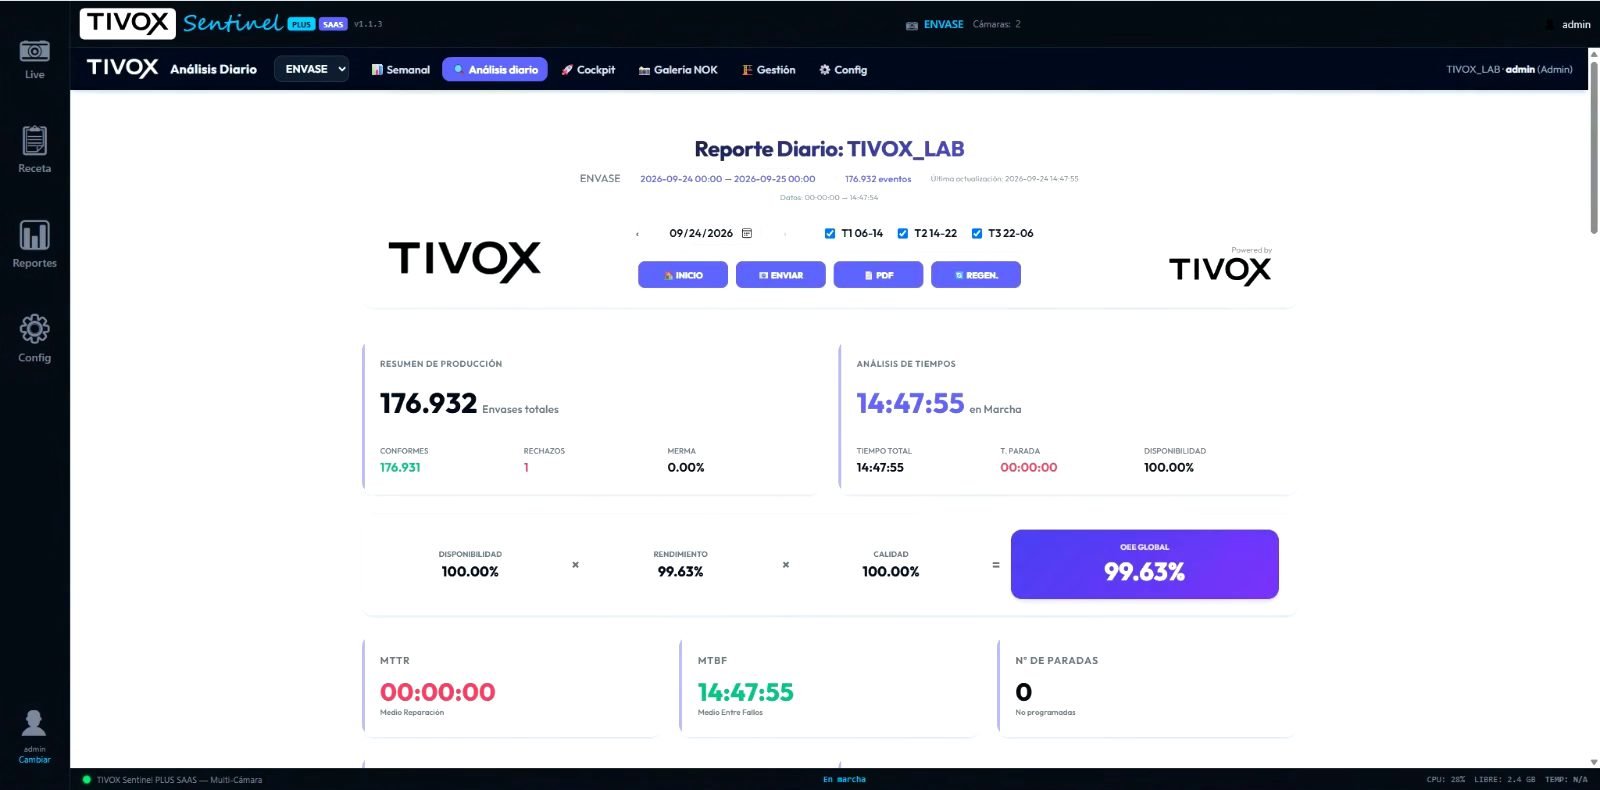
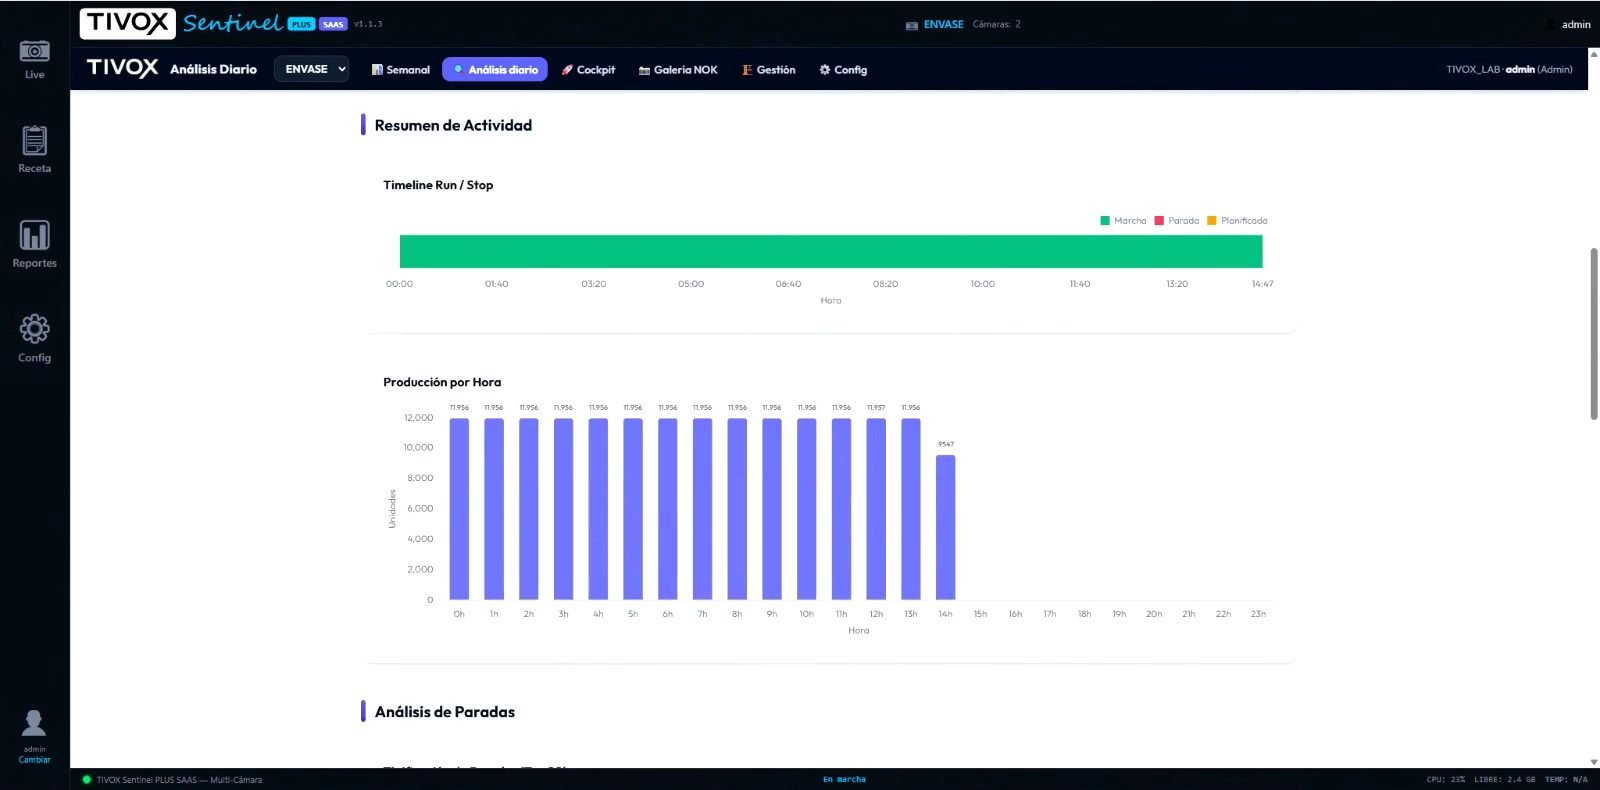
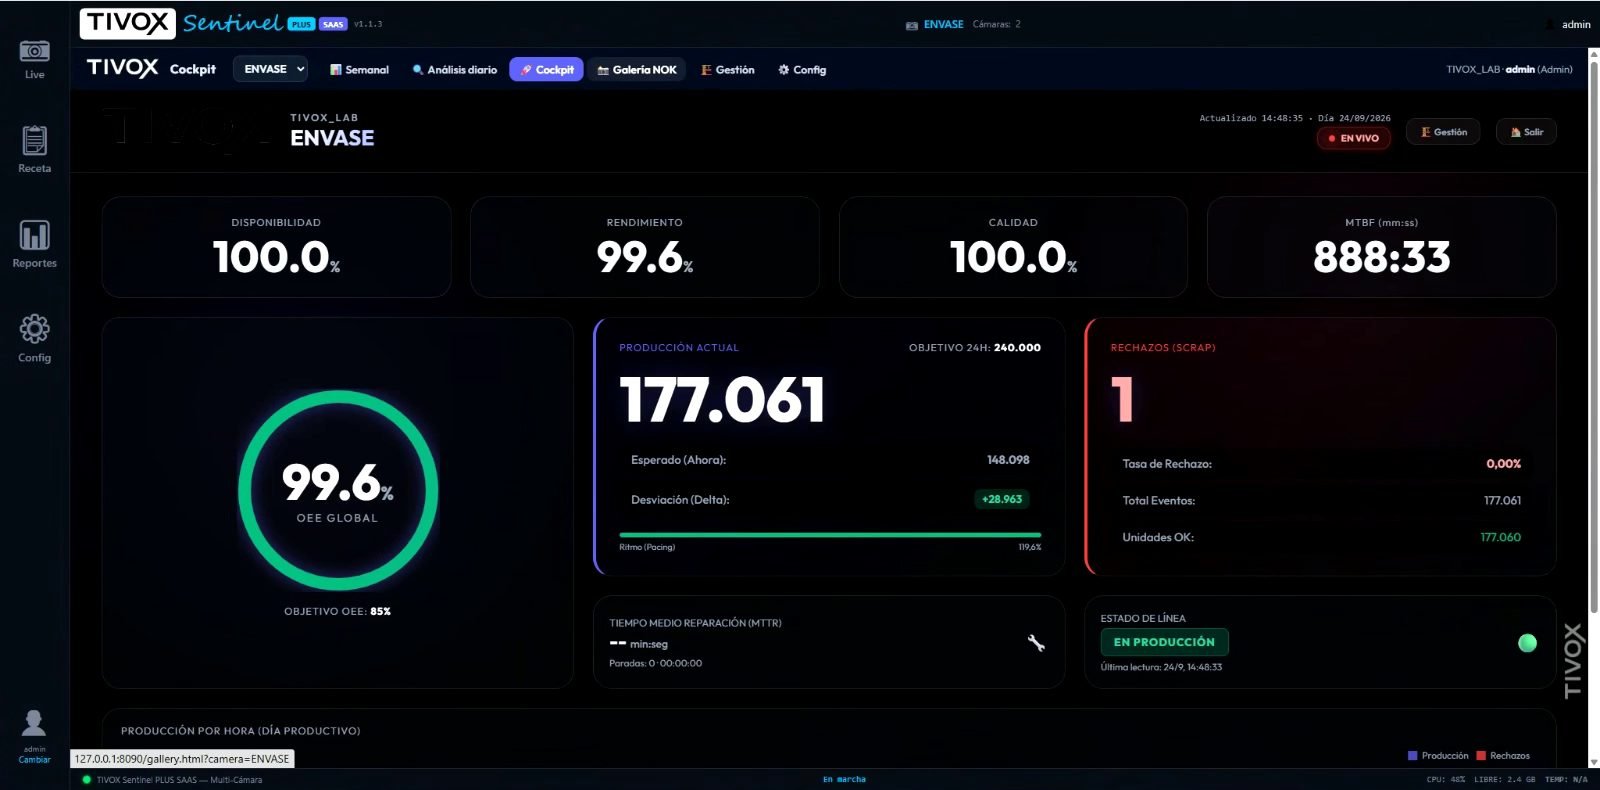
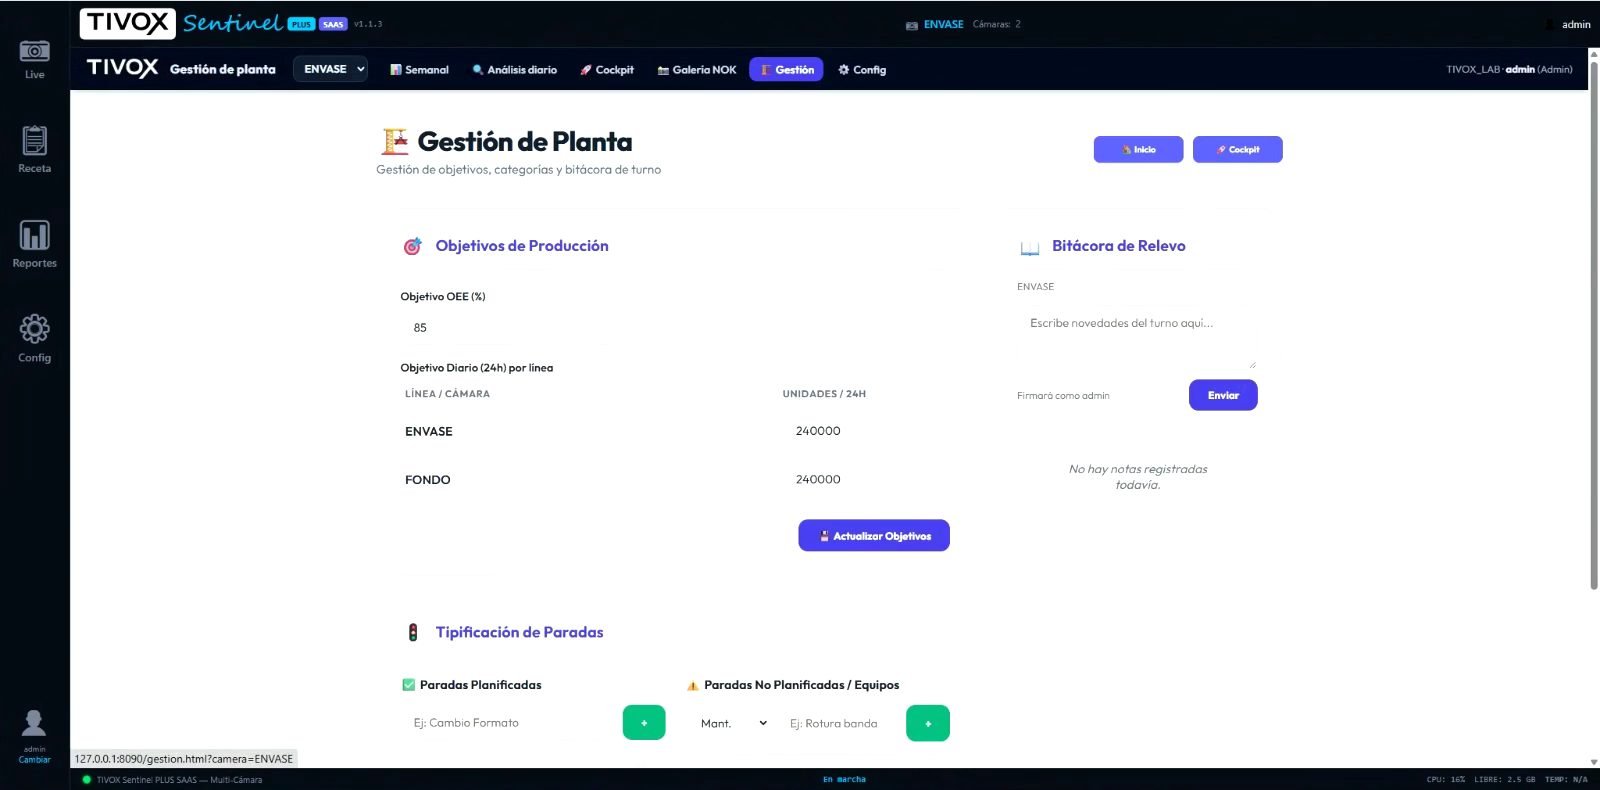
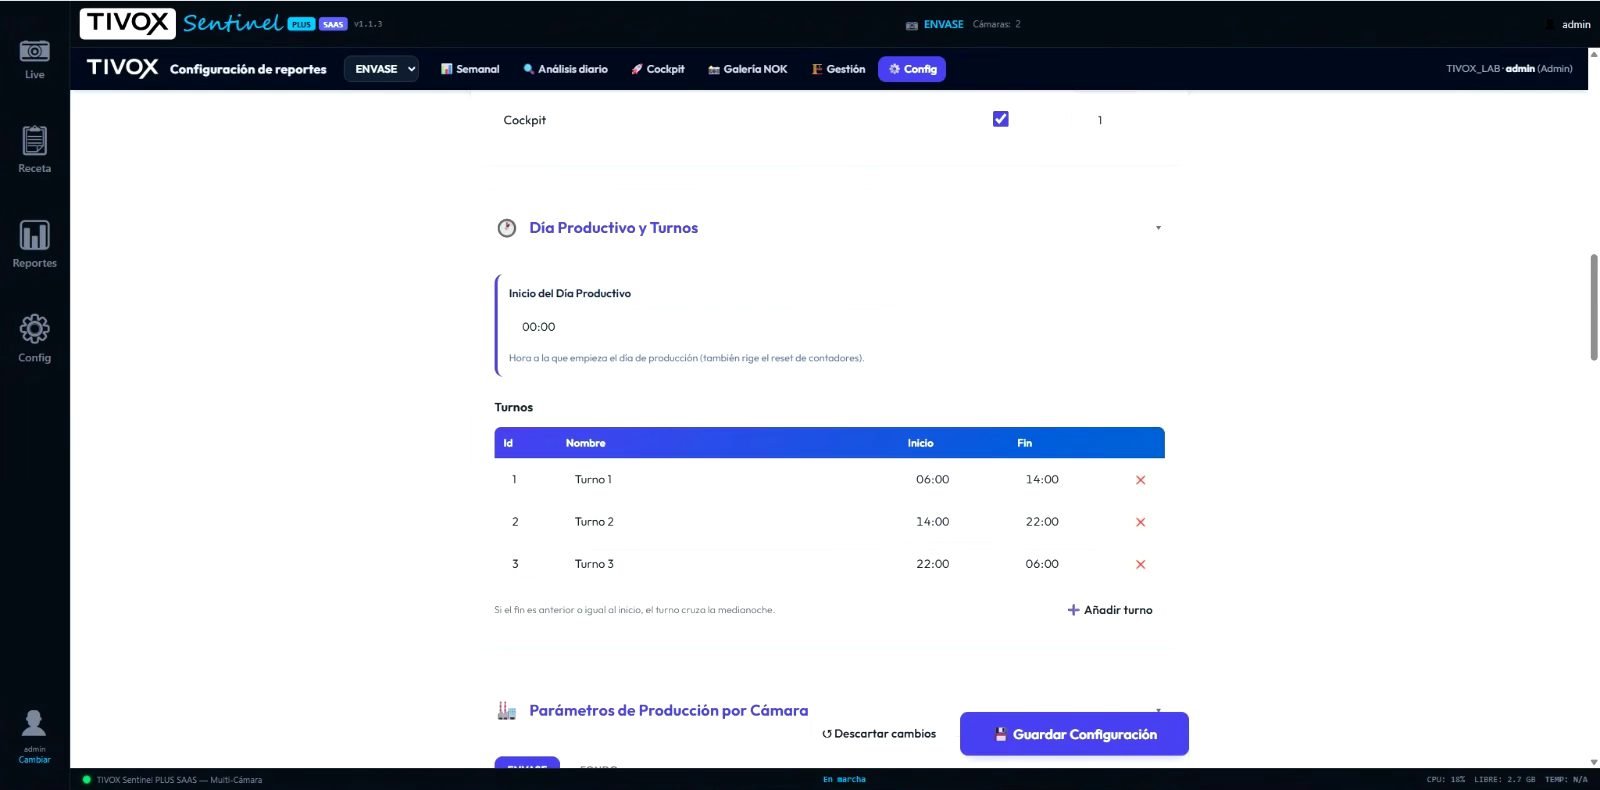
Reports with an AI analyst, daily analysis, plant cockpit, rejects with photos, shifts and live view: all in the same system.

02 · In-line
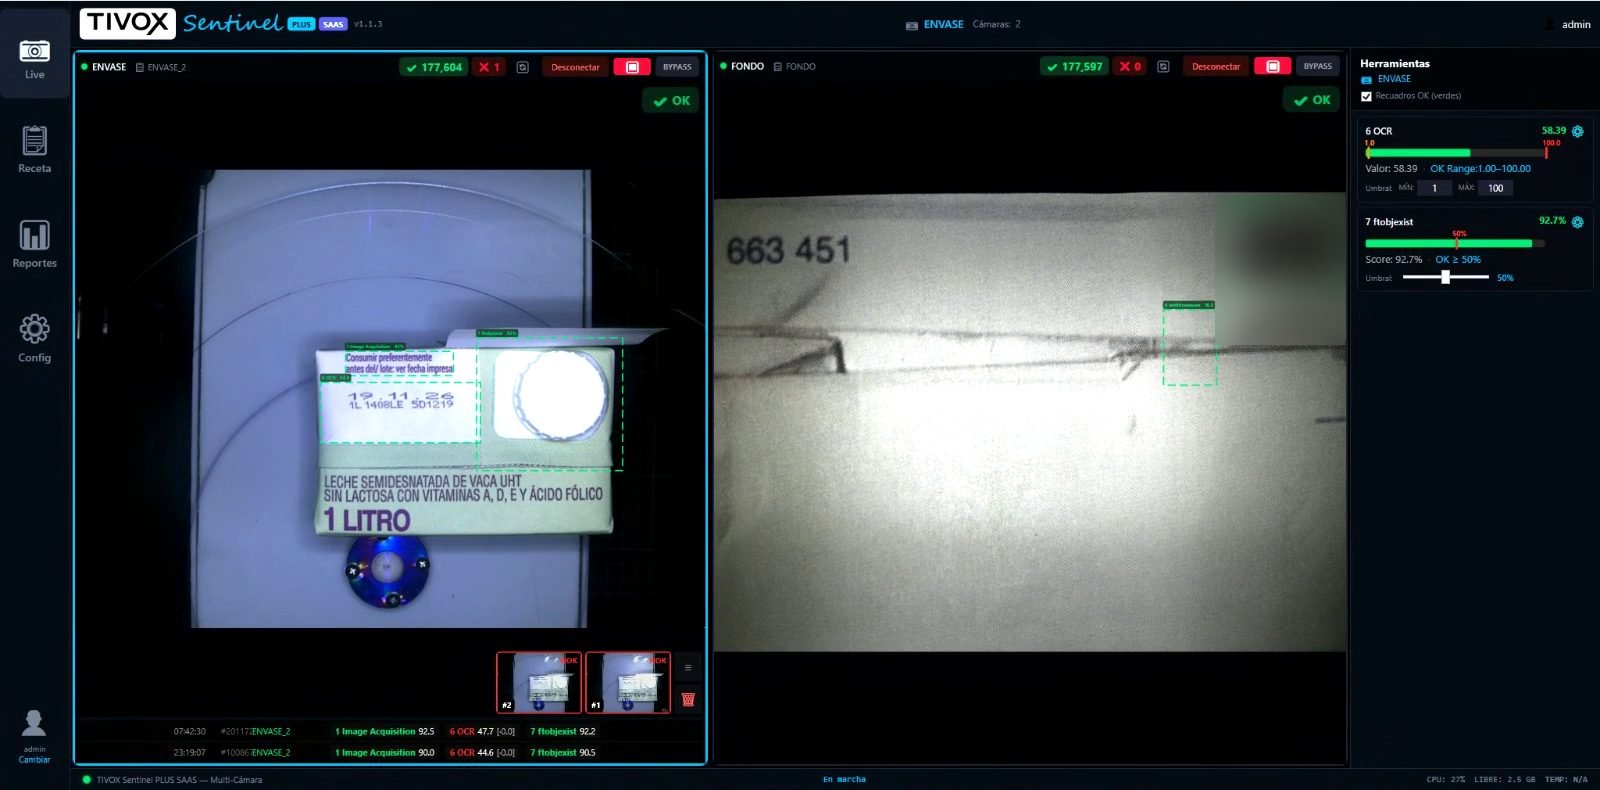
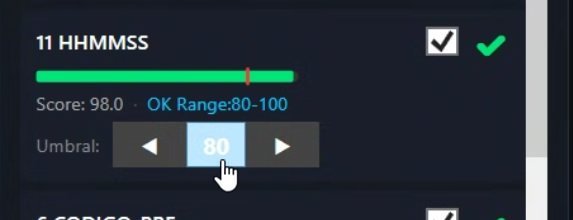
The live image with the inspection zones, the shift count and every tool with its score, accepted range and threshold. The operator can see why a pack is rejected. Thresholds can only be adjusted by the quality manager and maintenance, with their own login, and every change is logged.

Evidence
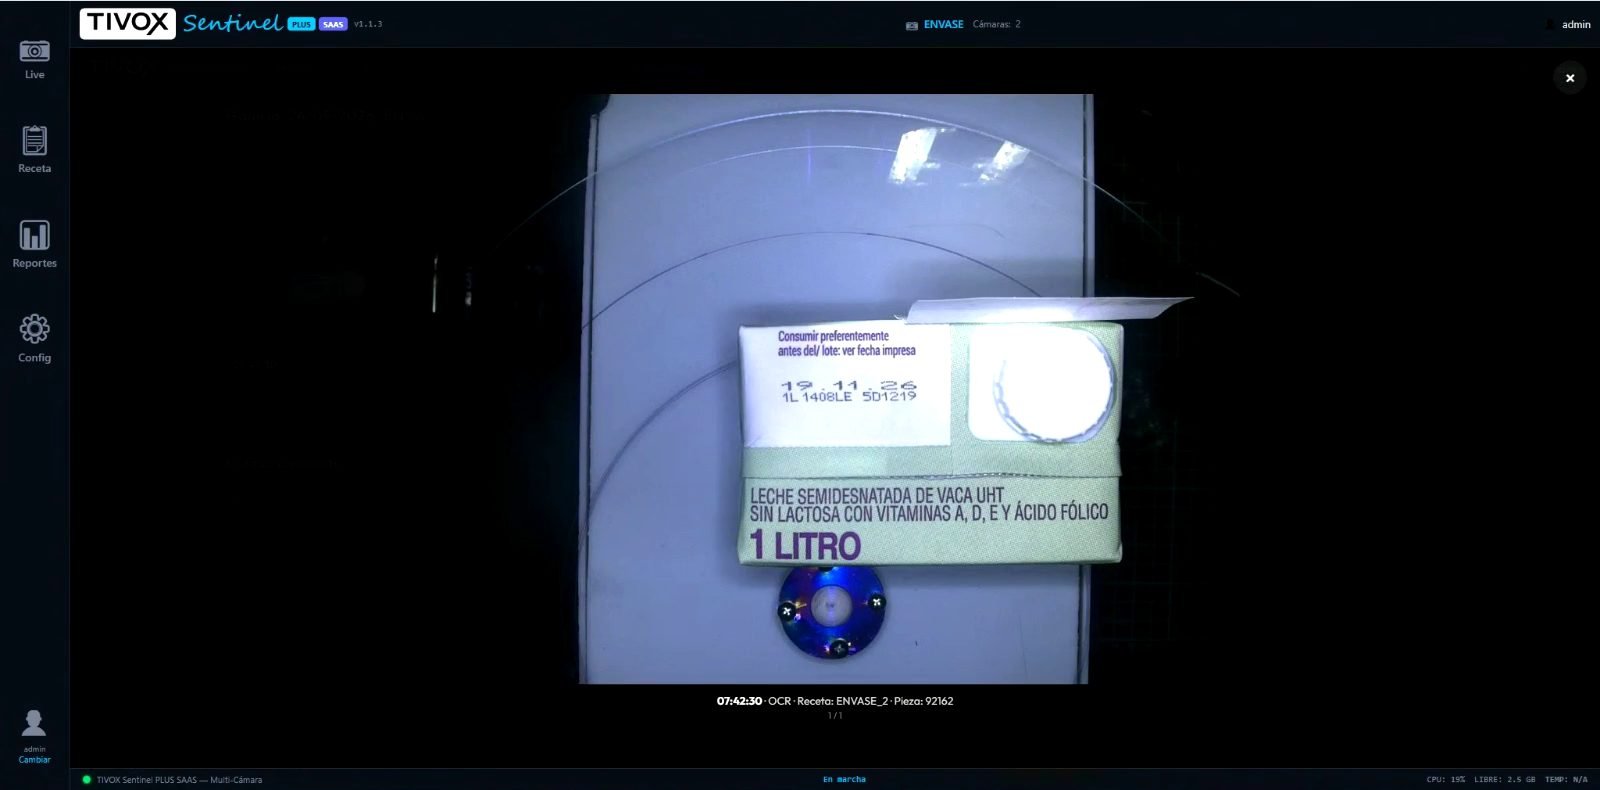
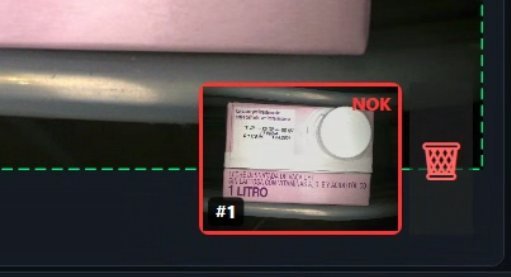
Tapping a reject opens the full-size image with the failed zone marked, the date and time, the frame number and the list of tools that didn't pass, with their score and accepted range.

02 · Statistical process control
Nadir applies statistics and deep learning to every pack that passes: it measures, calculates the mean and spread, and plots the Gaussian bell curve of each measurement. This shows whether the process is stable and detects drift before it turns into a defect. On carton packs, for example, it checks tube openings and seal quality.
03 · Plant · 04 · Company
Zenith brings every camera in the plant together on one screen, with its status and the shift count. Hub sends a heartbeat every five minutes from each line and shows in the cloud what is running, how much it produces, its OEE and its reject rate.

| Status | Plant / line | Version | Production | OEE | NOK | NOK rate |
|---|---|---|---|---|---|---|
| 01:14 | Plant ALine B · 1 L carton | 3.3.3 | 117,498 | 70.1% | 16 | 0.01% |
| 03:59 | Plant ALine C · 1 L carton | 3.3.3 | 2,245 | 81.0% | 0 | 0.00% |
| 04:13 | Plant BLine K · bottle | 3.3.3 | 211,425 | 51.6% | 12 | 0.01% |
| 01:20 | Plant BLine J · bottle | 3.3.3 | 164,562 | 63.0% | 3 | 0.00% |
| 02:05 | Plant CLine 1 · case | 3.3.3 | 7,356 | 81.8% | 27 | 0.37% |
| — | Plant CLine 2 · planned stoppage | 3.3.3 | 0 | — | 0 | — |
Mock-up with demo data: plant names are fictitious.
05 · Management
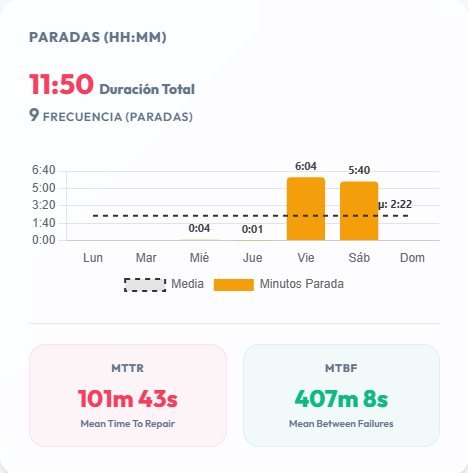
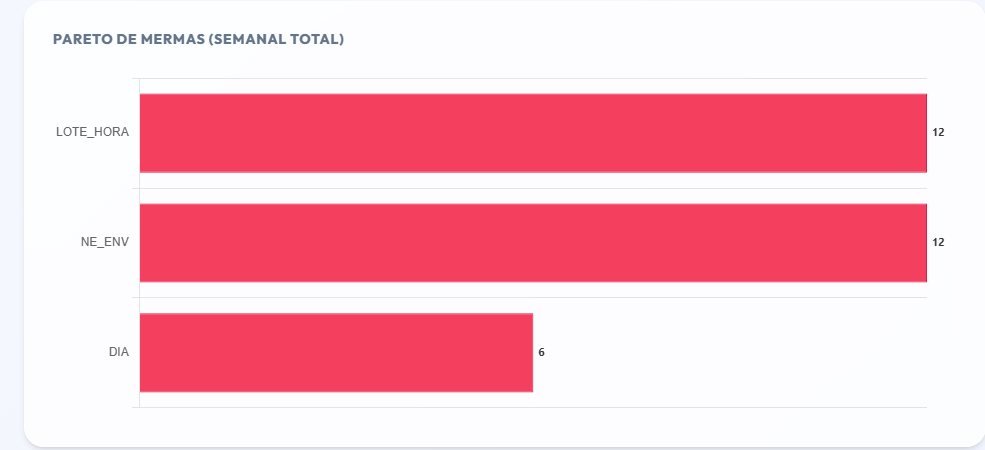
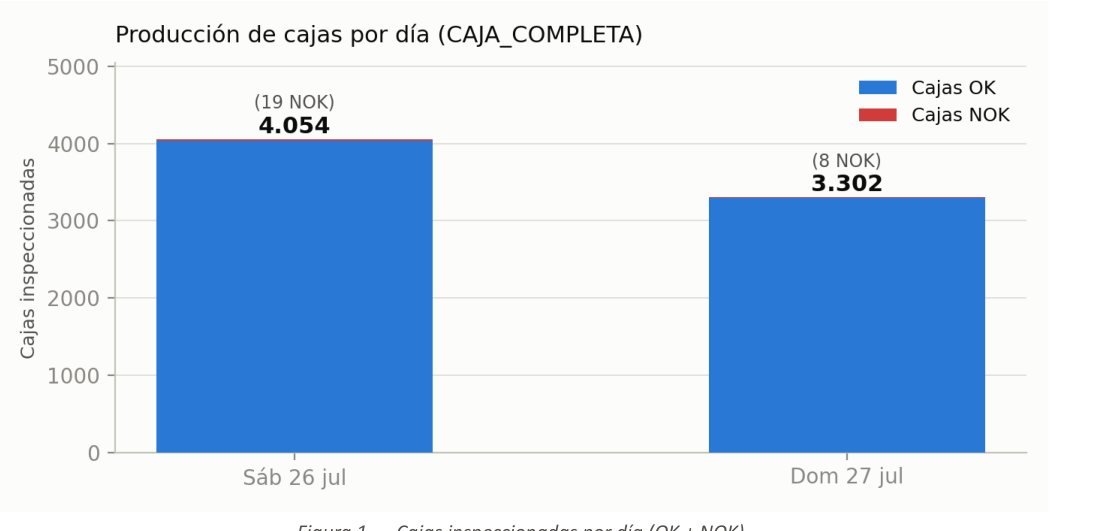
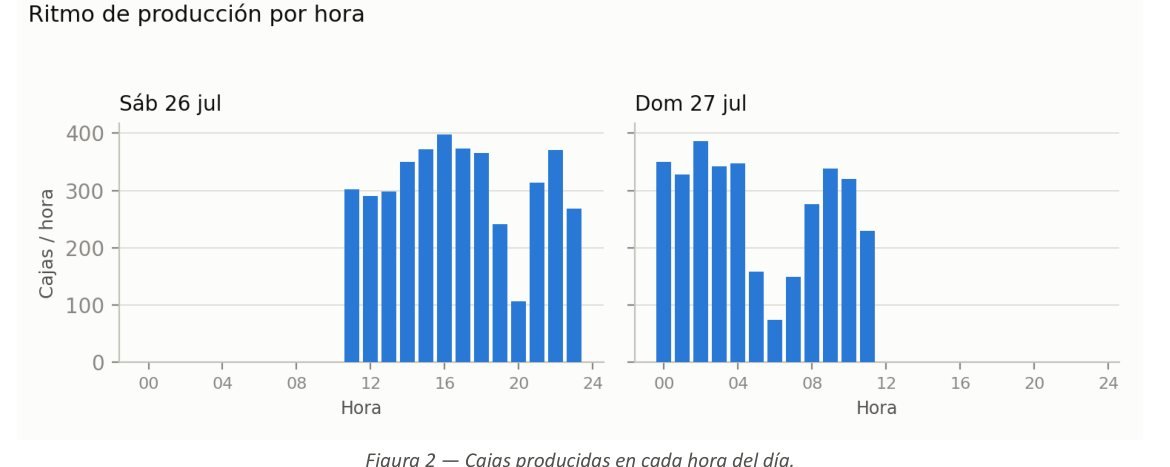
Data from every camera becomes weekly and production reports: how much was made, how much was scrapped, how long the line was stopped and why. The virtual AI analyst summarises the week and points out where the margin is. OEE, downtime and waste →


Alerts and reports
When something fails, the system alerts you at that very moment, on the channel each person actually uses, with the photo and the reason. And production reports arrive by email at the frequency the customer chooses.
[NOK] Line 1 · Packing time illegible (HHMMSS 75%, minimum 80). The line keeps running; pack rejected.
TIVOX · NOK L1 · Frame #20128 · Tool 11 HHMMSS · 75.1%. 3 rejects in the last hour.
Line 1 alert · Reject due to illegible time. Check the print head.
Production, rejects, stoppages and OEE by email, to whoever needs them and at the frequency you choose.
Access to the inspection history and CSV download for quality, ERP or your own analysis.
What triggers an alert, who receives it, on which channel and from how many rejects. Adjusted to each plant's real needs.
Integration
Sentinel PLUS connects to the line PLC and to your plant systems. The data is yours and stays in your plant; the cloud only receives what you decide.
Trigger, rejector, stack light and line status.
Results and history to MES, ERP or your database.
Instantly, with the photo, to quality, maintenance and the line manager.
Every recipe or threshold change is logged with user and time.
FAQ
Our own inspection and production data software. A single system covers the camera that inspects, the operator's screen, the plant control centre, the view of all plants and the report with OEE and AI analysis.
Instantly, by email, Telegram or WhatsApp, with the photo and the reason. Each alert is set up to suit each person.
Yes: inputs and outputs, Modbus TCP, OPC UA, SQL and CSV. The whole history can be downloaded and production reports arrive by shift, by day or by week.
Demo
We'll show you the complete system remotely or at your plant, with a recipe prepared for your format.